变更记录
序号 | 录入时间 | 备注
— | — | — | —
1 | 2017-06-03 | 新建文章
2 | 2018-02-28 | 更新引言
2 | 2018-04-14 | 整理格式
引言
你的代码,或者任何人的代码中总会有bug存在,你可以把调试看做是更好地理解代码的一种方式 —— By Advanced_Apple_Debugging_&_Reverse_Engineering_v0.9.5
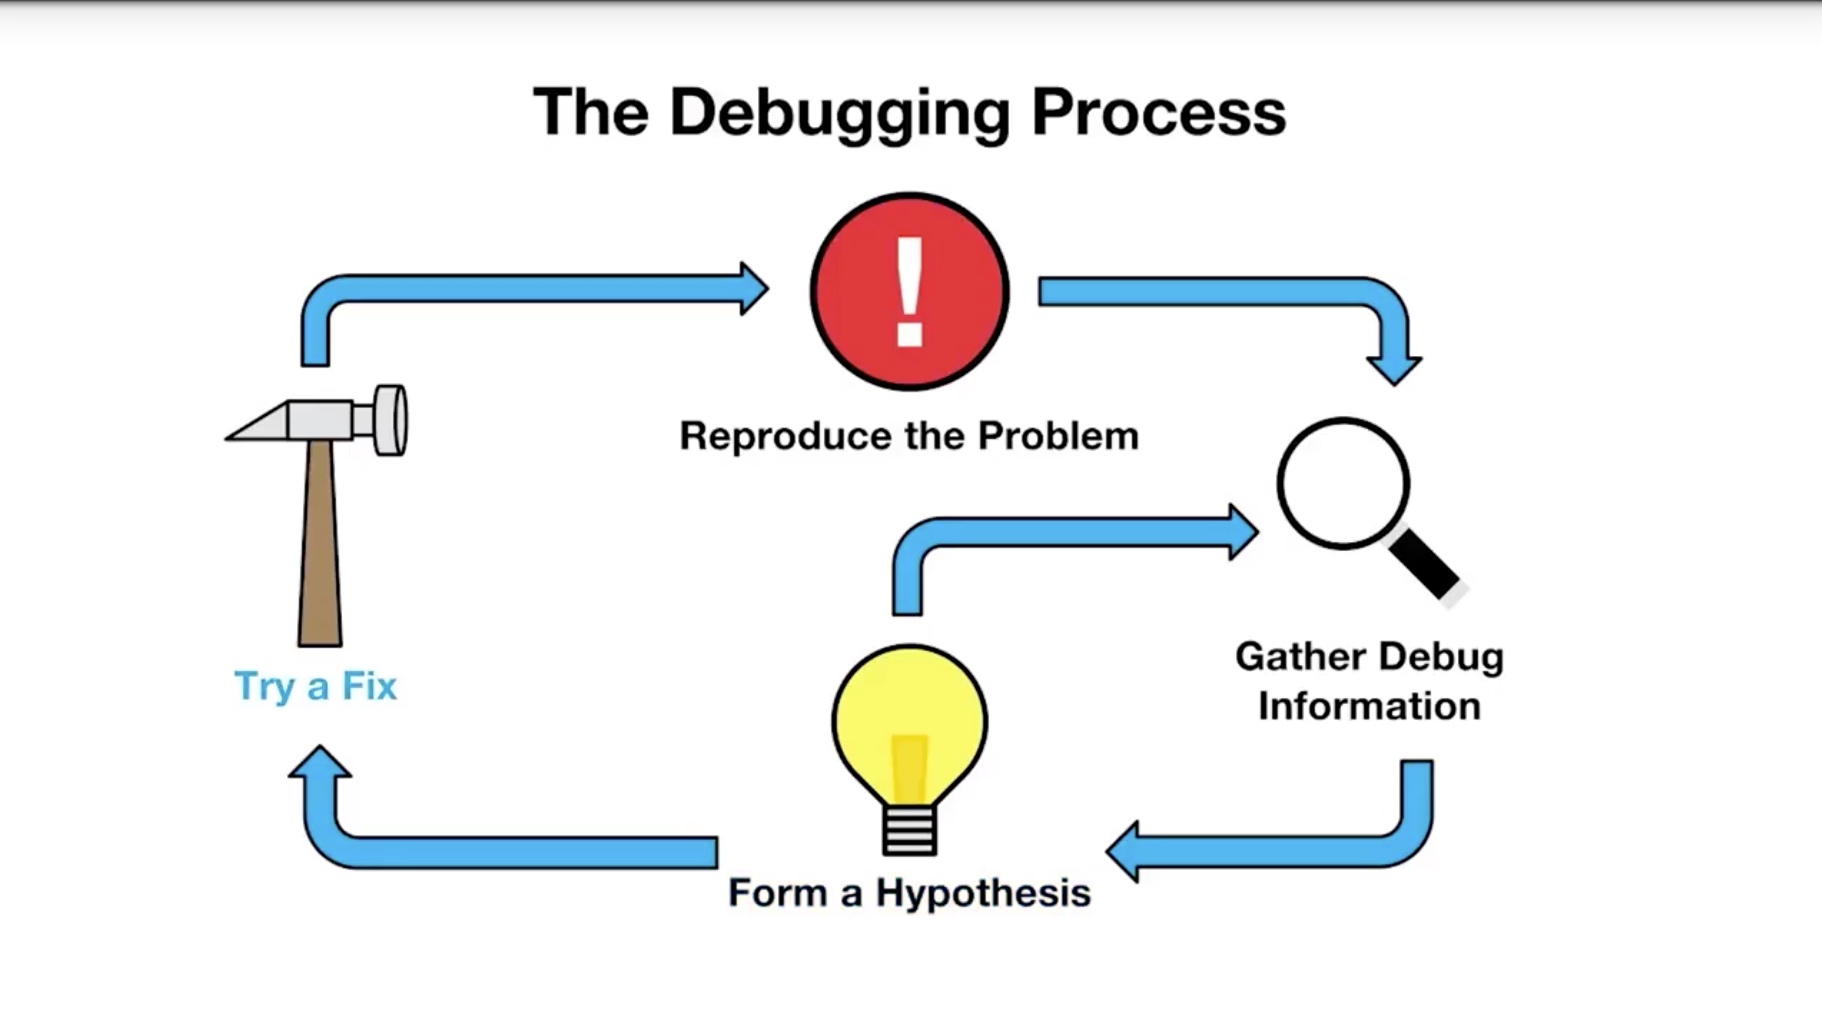
The Debugging Process
Reproduce the problem
if you cannot reproduce the problem, then you (probably) do not understand it.
Gather Debug Information
Logs, program, state,…
What is the value of a variable?
What kind of error?(ex.EXC_BAD_ACCESS)
What line of code caused the error?
Which functions or methods led to the error?Form a Hypothesis
Try a fix
Maximize the information gained per fix!
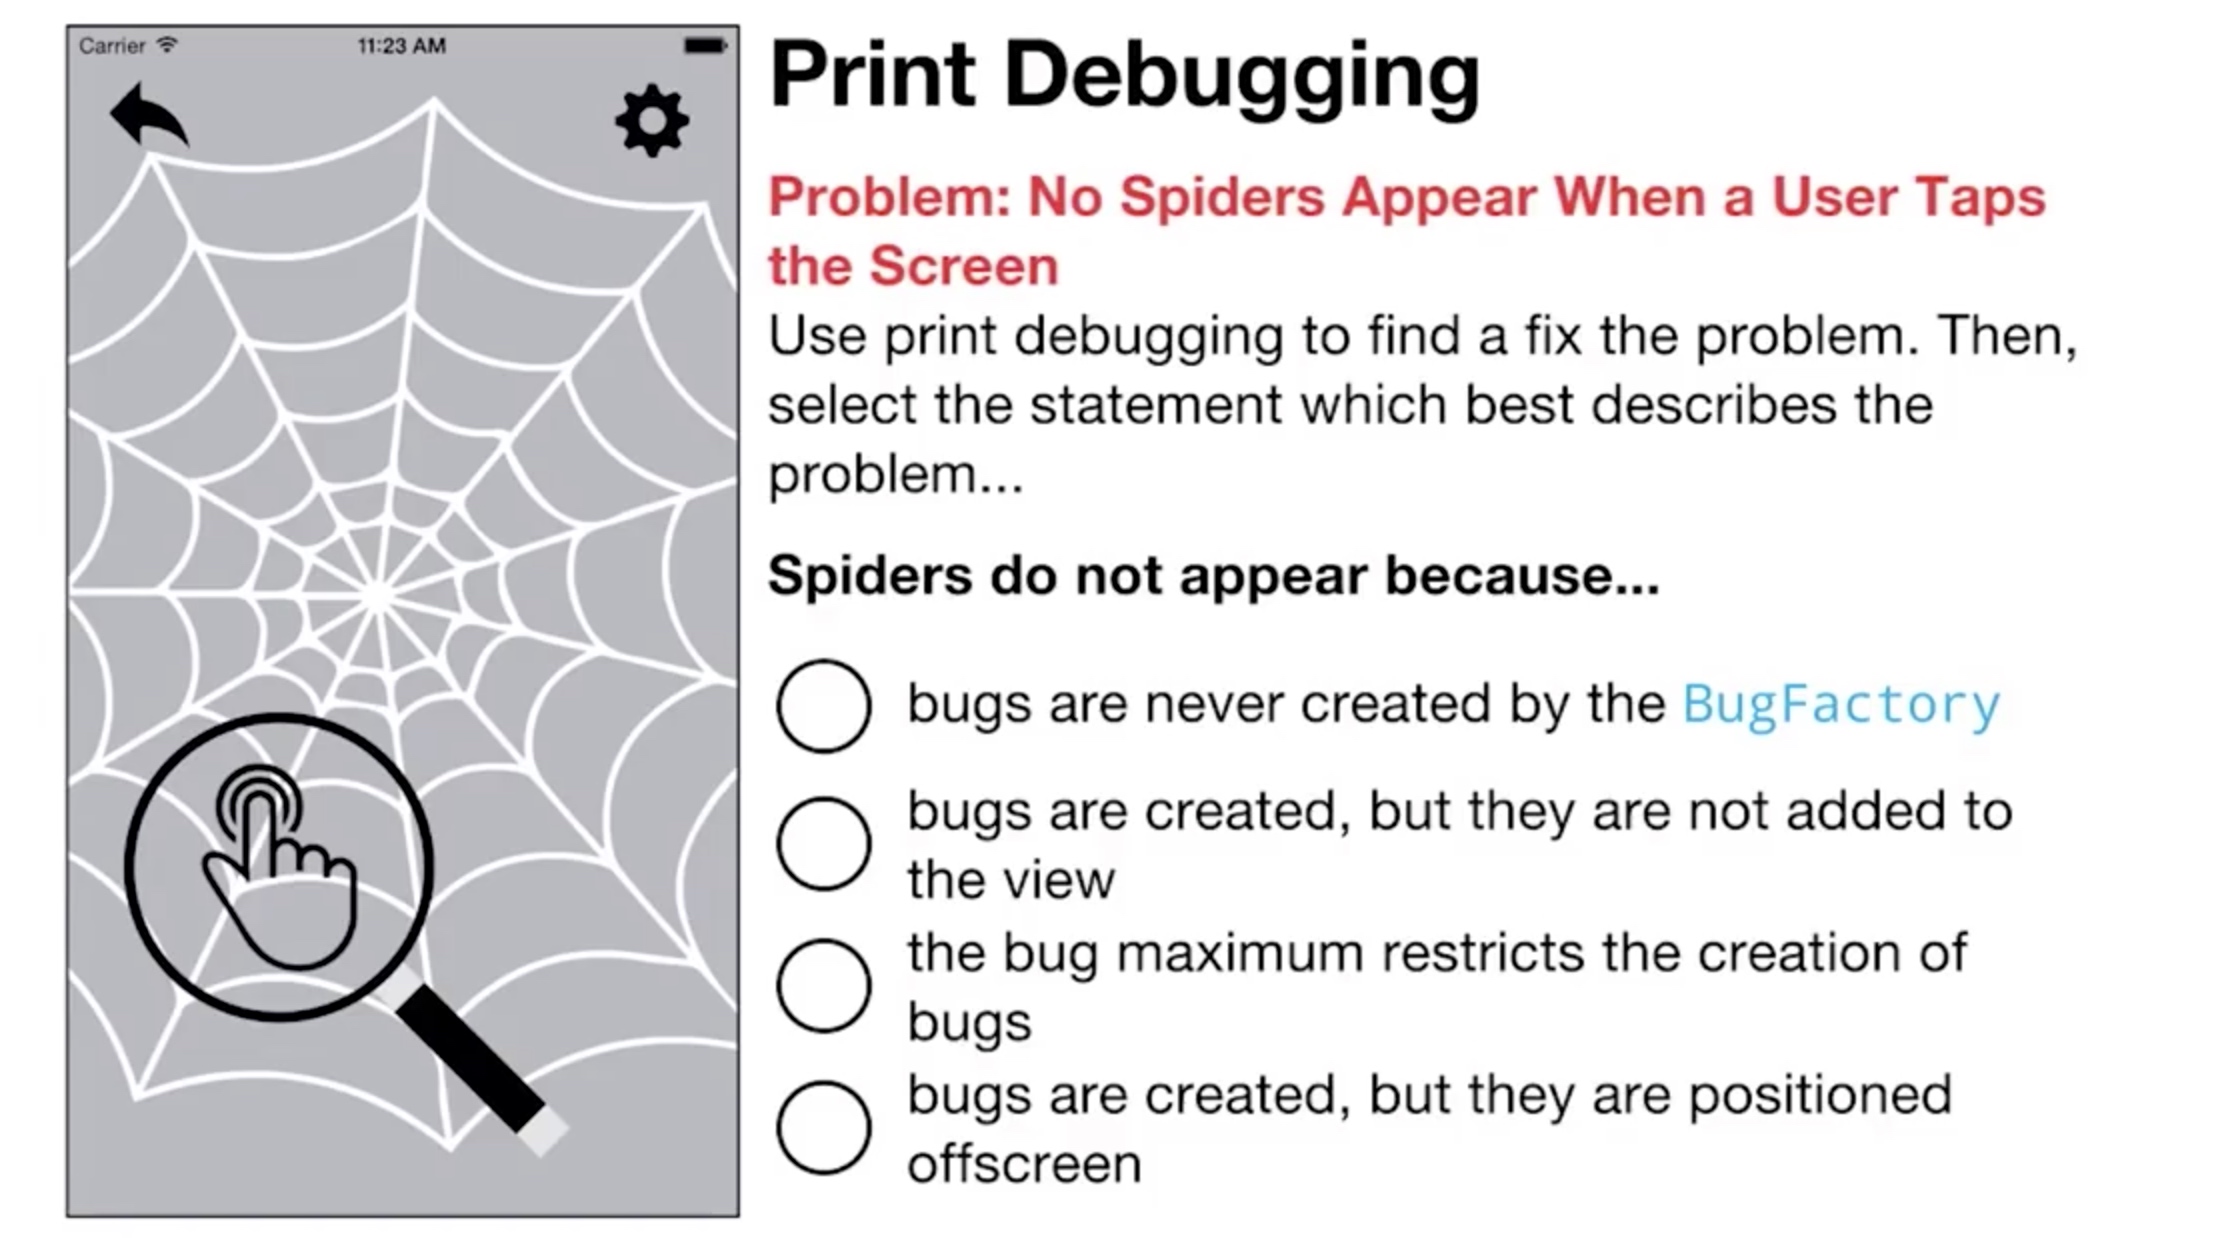
Print Debugging
TOOL
LLDB
Use commands to debugging, save your time in rebuild and make breakpoints.
常用命令
po —— call the description method on an object.
p —— print the value of 数量级 values
Print variable frame
frame variable fr v
Expression命令
expression命令的作用是执行一个表达式,并将表达式返回的结果输出。expression的完整语法是这样的:
1 | expression <cmd-options> -- <expr> |
说expression是LLDB里面最重要的命令都不为过。因为他能实现2个功能。
执行某个表达式。 我们在代码运行过程中,可以通过执行某个表达式来动态改变程序运行的轨迹。 假如我们在运行过程中,突然想把self.view颜色改成红色,看看效果。我们不必写下代码,重新run,只需暂停程序,用expression改变颜色,再刷新一下界面,就能看到效果
// 改变颜色 (lldb) expression -- self.view.backgroundColor = [UIColor redColor]
// 刷新界面 (lldb) expression -- (void)[CATransaction flush]
将返回值输出。 也就是说我们可以通过expression来打印东西。 假如我们想打印self.view:
Objective-C
(lldb) expression -- self.view
(UIView *) $1 = 0x00007fe322c18a10

(lldb) expression -- self.view
(UIView *) $1 = 0x00007fe322c18a10
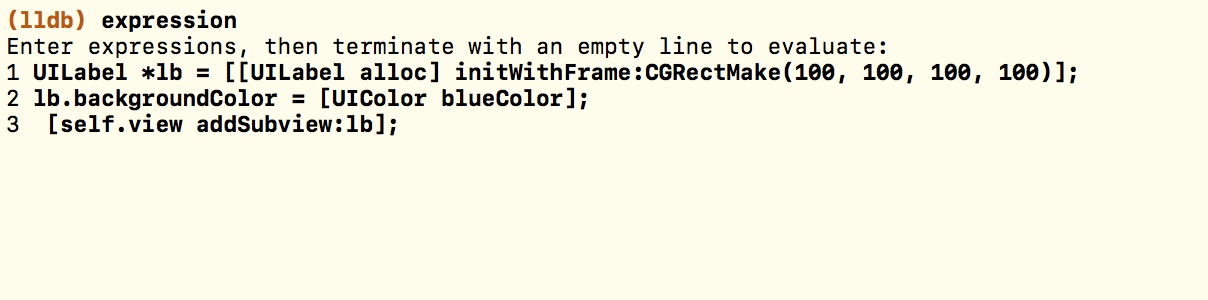
expression 可以支持多行输入,输入expression后回车,会显示行号,每行输入后换行,双击回车代表完成输入,过掉断言即刻看到表达式的效果。
BreakPoint
breakpoint command add给断点添加命令
e.g: 假设我们需要在ViewController的viewDidLoad中查看self.view的值
我们首先给-[ViewController viewDidLoad]添加一个断点
1 | (lldb) breakpoint set -n "-[ViewController viewDidLoad]" |
可以看到添加成功之后,这个breakpoint的id为3,然后我们给他增加一个命令:po self.view(lldb) breakpoint command add -o "po self.view" 3
-o完整写法是–one-liner,表示增加一条命令。3表示对id为3的breakpoint增加命令。
添加完命令之后,每次程序执行到这个断点就可以自动打印出self.view的值了
如果我们一下子想增加多条命令,比如我想在viewDidLoad中打印当前frame的所有变量,但是我们不想让他中断,也就是在打印完成之后,需要继续执行。我们可以这样玩:
1 | (lldb) breakpoint command add 3 |
输入breakpoint command add 3对断点3增加命令。他会让你输入增加哪些命令,输入’DONE’表示结束。这时候你就可以输入多条命令了
多次对同一个断点添加命令,后面命令会将前面命令覆盖
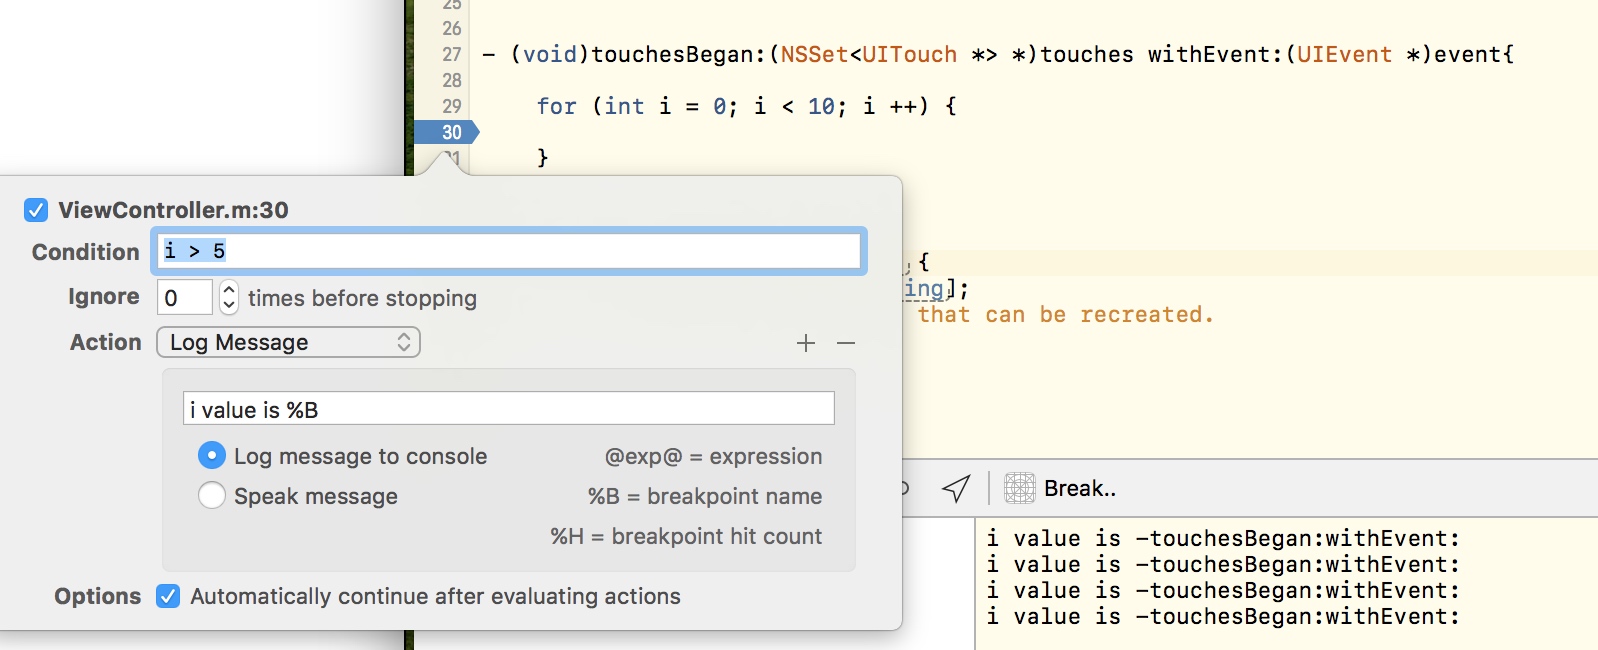
breakpoints添加通过条件

breakpoint
调试过程中,我们用得最多的可能就是断点了。LLDB中的断点命令也非常强大
breakpoint set
breakpoint set命令用于设置断点,LLDB提供了很多种设置断点的方式:
使用-n根据方法名设置断点:
e.g: 我们想给所有类中的viewWillAppear:设置一个断点:
(lldb) breakpoint set -n viewWillAppear:
Breakpoint 13: 33 locations.
使用-f指定文件
e.g: 我们只需要给ViewController.m文件中的viewDidLoad设置断点:
(lldb) breakpoint set -f ViewController.m -n viewDidLoad
Breakpoint 22: where = TLLDB`-[ViewController viewDidLoad] + 20 at ViewController.m:22, address = 0x000000010272a6f4
这里需要注意,如果方法未写在文件中(比如写在category文件中,或者父类文件中),指定文件之后,将无法给这个方法设置断点。
使用-l指定文件某一行设置断点
e.g: 我们想给ViewController.m第38行设置断点
(lldb) breakpoint set -f ViewController.m -l 38
Breakpoint 23: where = TLLDB`-[ViewController text:] + 37 at ViewController.m:38, address = 0x000000010272a7d5
使用-c设置条件断点
e.g: text:方法接受一个ret的参数,我们想让ret == YES的时候程序中断:
(lldb) breakpoint set -n text: -c ret == YES
Breakpoint 7: where = TLLDB`-[ViewController text:] + 30 at ViewController.m:37, address = 0x0000000105ef37ce
使用-o设置单次断点
e.g: 如果刚刚那个断点我们只想让他中断一次:
(lldb) breakpoint set -n text: -o
‘breakpoint 3’: where = TLLDB`-[ViewController text:] + 30 at ViewController.m:37, address = 0x000000010b6f97ce
breakpoint command
有的时候我们可能需要给断点添加一些命令,比如每次走到这个断点的时候,我们都需要打印self对象。我们只需要给断点添加一个po self命令,就不用每次执行断点再自己输入po self了
breakpoint command add
breakpoint command add命令就是给断点添加命令的命令。
e.g: 假设我们需要在ViewController的viewDidLoad中查看self.view的值
我们首先给-[ViewController viewDidLoad]添加一个断点
(lldb) breakpoint set -n “-[ViewController viewDidLoad]”
‘breakpoint 3’: where = TLLDB`-[ViewController viewDidLoad] + 20 at ViewController.m:23, address = 0x00000001055e6004
可以看到添加成功之后,这个breakpoint的id为3,然后我们给他增加一个命令:po self.view
(lldb) breakpoint command add -o “po self.view” 3
-o完整写法是–one-liner,表示增加一条命令。3表示对id为3的breakpoint增加命令。
添加完命令之后,每次程序执行到这个断点就可以自动打印出self.view的值了
如果我们一下子想增加多条命令,比如我想在viewDidLoad中打印当前frame的所有变量,但是我们不想让他中断,也就是在打印完成之后,需要继续执行。我们可以这样玩:
(lldb) breakpoint command add 3
Enter your debugger command(s). Type ‘DONE’ to end.
frame variable
continue
DONE
输入breakpoint command add 3对断点3增加命令。他会让你输入增加哪些命令,输入’DONE’表示结束。这时候你就可以输入多条命令了
多次对同一个断点添加命令,后面命令会将前面命令覆盖
breakpoint command list
如果想查看某个断点已有的命令,可以使用breakpoint command list。
e.g: 我们查看一下刚刚的断点3已有的命令
1 | (lldb) breakpoint command list 3 |
可以看到一共有2条命令,分别为frame variable和continue
1 | breakpoint command delete |
有增加就有删除,breakpoint command delete可以让我们删除某个断点的命令
e.g: 我们将断点3中的命令删除:
(lldb) breakpoint command delete 3
(lldb) breakpoint command list 3
Breakpoint 3 does not have an associated command.
可以看到删除之后,断点3就没有命令了
breakpoint list
如果我们想查看已经设置了哪些断点,可以使用breakpoint list
e.g:
(lldb) breakpoint list
Current breakpoints:
4: name = ‘-[ViewController viewDidLoad]’, locations = 1, resolved = 1, hit count = 0
4.1: where = TLLDB`-[ViewController viewDidLoad] + 20 at ViewController.m:23, address = 0x00000001055e6004, resolved, hit count = 0
我们可以看到当前只有一个断点,打在-[ViewController viewDidLoad]上,id是4
breakpoint disable/enable
有的时候我们可能暂时不想要某个断点,可以使用breakpoint disable让某个断点暂时失效
e.g: 我们来让刚刚的断点4失效
(lldb) breakpoint disable 4
1 breakpoints disabled.
输入完命令之后,显示断点已经失效
当我们又需要这个断点的时候,可以使用breakpoint enable再次让他生效
e.g: 重新启用断点4
(lldb) breakpoint enable 4
1 breakpoints enabled.
breakpoint delete
如果我们觉得这个断点以后再也用不上了,可以用breakpoint delete直接删除断点.
e.g: 删除断点4
(lldb) breakpoint delete 4
1 breakpoints deleted; 0 breakpoint locations disabled.
如果我们想删除所有断点,只需要不指定breakpoint delete参数即可
(lldb) breakpoint delete
About to delete all breakpoints, do you want to do that?: [Y/n] y
All breakpoints removed. (1 breakpoint)
删除的时候他会提示你,是不是真的想删除所有断点,需要你再次输入Y确认。如果想直接删除,不需要他的提示,使用-f命令选项即可
(lldb) breakpoint delete -f
All breakpoints removed. (1 breakpoint)
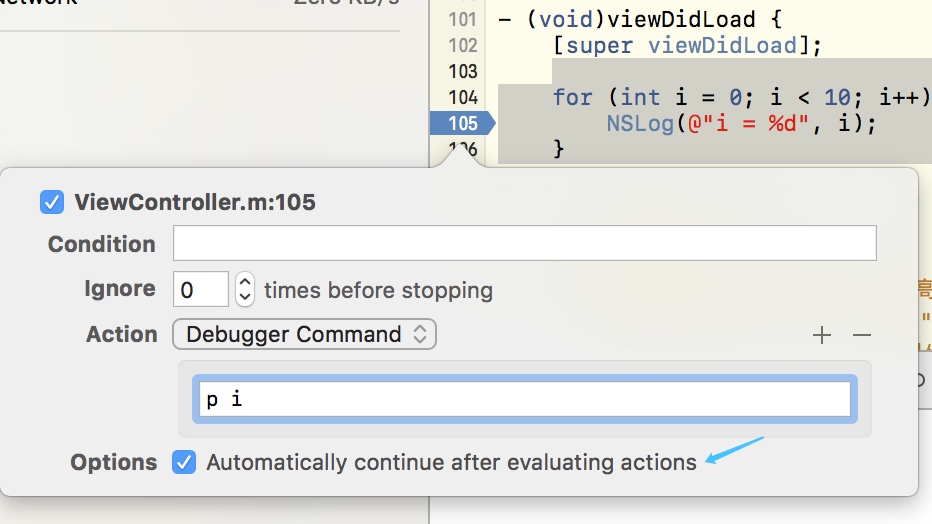
实际平时我们真正使用breakpoint命令反而比较少,因为Xcode已经内置了断点工具。我们可以直接在代码上打断点,可以在断点工具栏里面查看编辑断点,这比使用LLDB命令方便很多。不过了解LLDB相关命令可以让我们对断点理解更深刻。
如果你想了解怎么使用Xcode设置断点,可以阅读这篇文章《Xcode中断点的威力》
打印所在的方法:
非重写方法的符号断点
非重写方法的符号断点
假设你想知道 -[MyViewController viewDidAppear:] 什么时候被调用。如果这个方法并没有在MyViewController 中实现,而是在其父类中实现的,该怎么办呢?试着设置一个断点,会出现以下结果:
1 | (lldb) b -[MyViewController viewDidAppear:] |
因为 LLDB 会查找一个符号,但是实际在这个类上却找不到,所以断点也永远不会触发。你需要做的是为断点设置一个条件 [self isKindOfClass:[MyViewController class]],然后把断点放在 UIViewController 上。正常情况下这样设置一个条件可以正常工作。但是这里不会,因为我们没有父类的实现。
viewDidAppear: 是苹果实现的方法,因此没有它的符号;在方法内没有 self 。如果想在符号断点上使用 self,你必须知道它在哪里 (它可能在寄存器上,也可能在栈上;在 x86 上,你可以在 $esp+4 找到它)。但是这是很痛苦的,因为现在你必须至少知道四种体系结构 (x86,x86-64,armv7,armv64)。想象你需要花多少时间去学习命令集以及它们每一个的调用约定,然后正确的写一个在你的超类上设置断点并且条件正确的命令。幸运的是,这个在 facebook的Chisel 被解决了。这被成为 bmessage:
1 | (lldb) bmessage -[MyViewController viewDidAppear:] |
command和expr的组合
建立一个breakPoint.
使用expr表达式
用command添加到br上面。
1 | br com add 1 |
Thread
thread until (line number)thread select (thread number)thread return (value)frame variable 查看线程相关变量bt (thread backtrace) backtrace
Watchpoint
Chisel
border 标记viewmask 标记viewpca layer treepresponder responder chainpclass class hierachyvs vs view, change the view hierachycaflush refresh screenvisualize previews viewspviews Print the recursive view description for the key window.pvc Print the recursive view controller description for the key window. fv Find a view in the hierarchy whose class name matches the provided regex. fvc Find a view controller in the hierarchy whose class name matches the provided regex.bmessage Set a symbolic breakpoint on the method of a class or the method of an instance without worrying which class in the hierarchy actually implements the method.wivar Set a watchpoint on an instance variable of an object.
Xcode Debugging Hotkeys
Here is a listing of Xcode hotkeys (related to debugging) we mentioned in this course. Let us know if we missed any!
1 | Show Navigator (⌘+0) |
Icon Injection Plugin for Xcode
Icon Injection Plugin for Xcode

一个Xcode的插件,让你在改完代码后无需重新运行Xcode就可以看到效果。
将需要调试的代码写到injected这个方法中,然后在和这个方法中设置一个断言,使用Ctr + =,即会停在这个断言里,每次修改,使用一下Ctr + =就会重新注入,释放断言就可以看到效果。
1 | - (void)injected |
The plugin can be removed either via Alcatraz, or by running:
rm -rf ~/Library/Application\ Support/Developer/Shared/Xcode/Plug-ins/InjectionPlugin.xcplugin
注意
1 | - (void)injected as an instance method, which gives you the chance to re-update an object with new contexts. |
原理
它通过解析应用程序的生成日志来确定源文件是如何最后编译的。用这个包将重新编译成一个bundle,该bundle使用动态加载程序注入应用程序。现在在bundle中就有两个版本,原版本和新的修改版本。修改后的版本是“调和”在原版本发生变化。
LLDB cheatsheet
A cheatsheet for commands and ideas on how to use LLDB.
Getting help
(lldb) help
List all commands and aliases.
(lldb) help po
Get help documentation for po (expression) command.
(lldb) help break set
Get help documentation for breakpoint set.
(lldb) apropos step-in
Search through help documentation containing step-in.
Finding code
(lldb) image lookup -rn UIAlertController
Look up all code containing UIAlertController that’s compiled or loaded into an executable.
(lldb) image lookup -rn (?i)hosturl
Case insensitive search for any code that contains “hosturl”.
(lldb) image lookup -rn 'UIViewController\ set\w+:\]'
Look up all setter property methods UIViewController implements or overrides.
(lldb) image lookup -rn . Security
Look up all code located within the Security module.
(lldb) image lookup -a 0x10518a720
Look up code based upon address 0x10518a720.
(lldb) image lookup -s mmap
Look up code for the symbol named mmap.
Breakpoints
(lldb) b viewDidLoad
Creates a breakpoint on all methods named viewDidLoad for both Swift and Objective-C.
(lldb) b setAlpha:
Creates a breakpoint on either the setAlpha: Objective-C method or the setter of the Objective-C alpha property.
(lldb) b -[CustomViewControllerSubclass viewDidLoad]
Creates a breakpoint on the Objective-C method [CustomViewControllerSubclass viewDidLoad].
(lldb) rbreak CustomViewControllerSubclass.viewDidLoad
Creates a regex breakpoint to match either an Objective-C or Swift class CustomViewControllerSubclass which contains viewDidLoad. Could be Objective-C - [CustomViewControllerSubclass viewDidLoad] or could be Swift ModuleName.CustomViewControllerSubclass.viewDidLoad () -> ().
(lldb) breakpoint delete
Deletes all breakpoints.
(lldb) breakpoint delete 2
Deletes breakpoint ID 2.
(lldb) breakpoint list
List all breakpoints and their IDs.
(lldb) rbreak viewDid
Creates a regex breakpoint on .viewDid..
(lldb) rbreak viewDid -s SwiftRadio
Creates a breakpoint on .viewDid., but restricts the breakpoint(s) to the SwiftRadio module.
(lldb) rbreak viewDid(Appear|Disappear) -s SwiftHN
Creates a breakpoint on viewDidAppear or viewDidDisappear inside the SwiftHN module.
(lldb) rb "\-\[UIViewController\ set" -s UIKit
Creates a breakpoint on any Objective-C style breakpoints containing - [UIViewController set within the UIKit module.
(lldb) rb . -s SwiftHN -o
Create a breakpoint on every function in the SwiftHN module, but remove all breakpoints once the breakpoint is hit.
(lldb) rb . -f ViewController.m
Create a breakpoint on every function found in ViewController.m.
Expressions
(lldb) po "hello, debugger"
Prints “hello, debugger” regardless of the debugging context.
(lldb) expression -lobjc -O -- [UIApplication sharedApplication]
Print the shared UIApplication instance in an Objective-C context.
(lldb) expression -lswift -O -- UIApplication.shared
Print the shared UIApplication instance in a Swift context.